2.
Activities within this Step
The table below provides a quick reference for the activities within this
step.
|
CTRL + click the activities for activity details ->
|

|

|

|

|

|
|
Inputs (source)
|
Stakeholder Exchange
Diagrams (Step 2)
SWOT Analysis Diagram
(Step 2)
Vision Document (Step 2)
Goals and Objectives
Hierarchy Diagram with Baseline Data (Step 2)
Business Area Goals and
Objectives to Parent Organization's Goals and Objectives Matrix (Step 2)
Business Strategy to
Mandates Matrix (Step 2)
Business Products and
Services Matrix (Step 2)
|
Stakeholder Exchange
Diagrams (Step 2)
As-Is Value Chain Diagram
Target Value Chain Diagram
As-Is Value Chain to Business Products and Services
Diagram
Target Value Chain to Business Products and Services
Diagram
Organization’s Business Reference Model
|
As-Is Value Chain to Business Products and Services
Diagram
Target Value Chain to Business Products and Services
Diagram
Business Function Model
Existing documentation of current business process
Existing documentation of current and planned investments
Stakeholder Exchange
Diagrams (Step 2)
|
Target Value Chain Diagram
Business Function Model
As-Is Swim Lane Process Diagram (actual organization)
Existing Investments to Business Products and Services /
Functions Matrix
Organization’s Data Reference Model
Stakeholder Exchange
Diagrams (Step 2)
|
All products from this step
|
|
Outputs
|
As-Is Value Chain Diagram
Target Value Chain Diagram
As-Is Value Chain to Business Products and Services
Diagram
Target Value Chain to Business Products and Services
Diagram
|
Business Function Model
|
Existing Investments to Business Products and Services /
Functions Matrix
As-Is Swim Lane Process Diagram (actual organization)
|
Target Swim Lane Process Diagram (proposed organizations)
Activity Diagrams for Critical Value Chain Components
Target Information Exchanges
Target Logical Data Model
Target Business Activity to Data Entity CRUD Matrix
Target Data Entity Stewardship Matrix
|
Business Process and Data Analysis Presentation
|
|
Who
(role)
|
Core Team
[R, C, I]
Executive Sponsor [I, C]
Business Expert [I]
Enterprise
Architect [Support]
|
Core Team
[R, C, I]
Executive Sponsor [I, C]
Business Expert [I]
Enterprise
Architect [Support]
|
Core Team
[R, C, I]
Executive Sponsor [I, C]
Business Expert [I]
Enterprise
Architect [Support]
|
Core Team
[R, C, I]
Executive Sponsor [I, C]
Business Expert [I]
Principal Data Stewards [C]
Enterprise
Architect [Support]
|
Core Team
[R, C, I]
Executive Sponsor [I, C]
Business and Data Governance Teams [C]
Enterprise
Architect [Support]
|
|
Duration (calendar days for an average project based on
past projects)
|
5 days
|
5 days
|
15 days
|
25 days
|
10 days
|
|
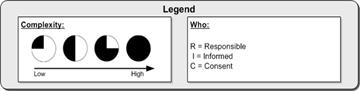
Complexity
|

|

|

|

|
|
|
|
Keys to Success:
The key to the business analysis is to analyze to the
lowest level of detail that is necessary to form actionable
recommendations. Additionally, it is
important that data and business analysis results be in sync.
|
3. Activity
Details
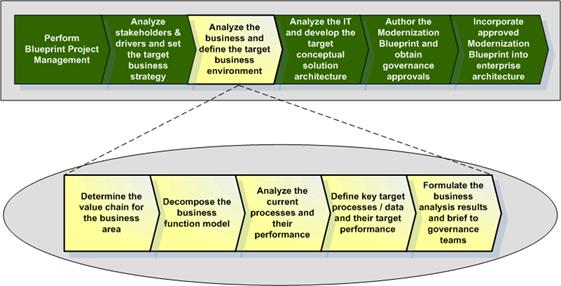
Activity 1 – Determine the
value chain for the business area
Activity Short Description:
Using the business
products and services identified during Step 2, the functions and activities
that the business area must perform in order to deliver those business products
and services are identified. This activity
should begin with a high-level focus on the key business activities that
deliver products and services, and then drill down to identify the critical
functions and capabilities that further define the high-level business
activities.
Activity Tasks:
1.
List the functions that are currently performed
by the business area and the functions that are currently leveraged by the
business area (infrastructure, etc).
a. Functions
represent neither processes nor services, but are units of work that flow
together in a process to create a product or service.
2.
Diagram the current state functions in a value
chain drawing to describe the value that is currently being produced by the
business area.
a. The
value chain drawing is a high-level logical grouping of functions that provides
an overview of how value is produced.
Examples of functions include customer service, procurement, and
manufacturing.
3.
List the functions that would need to be
performed by the business area in order to deliver the target business products
and services. This also includes
functions that are currently leveraged by the business area (infrastructure,
etc).
a. There
is likely to be a great deal of overlap between the current state functions and
the functions necessary to deliver the target business products and services.
4.
Diagram the target state functions in a value
chain drawing describing the value that will be produced by the business area.
a. The
target state value must be consistent with the business products and services
being produced. The intent of the value
chain analysis is to identify any differences in the functions that are
currently being provided versus those that need to be provided. The value chain analysis will primarily help
determine where new functions are required, or where existing functions may no
longer be necessary.
5.
Map the target business products and services to
the value chain
a. The
existing business products and services are mapped to the As-Is Value
Chain. The target state business
products and services are also mapped to the Target Value Chain. This helps identify the value chain
components that are most critical to delivering business products and services
identified in Step 2. The intent of this
activity is to limit the number of functions that will be analyzed at a lower
level of detail in subsequent MBT activities.
b. Note
that, for new value chain functions, subsequent analysis may require a
significant amount of effort. This can
greatly increase the overall scope and complexity of the modernization
blueprint recommendations.
Activity Communications Considerations:
Consultation with business experts is essential to
ensure validity of the value chain analysis
The results of the value chain analysis may need to be
shared with key stakeholders to confirm the prioritization of the critical
value chain components
Activity Work Products and Templates:
As-Is Value Chain Diagram: The As-Is Value Chain Diagram describes the current
sequence of activities that deliver products or services. Activities in the value chain are designated
as being either primary or support activities.
This work product is useful in evaluating the value of each particular
activity adds to the organization’s products or services.
·
TEMPLATE: Link
to As-Is Value Chain Diagram Template (Visio)
·
TEMPLATE: Link
to As-Is Value Chain Diagram Template (PDF)
Target Value Chain Diagram: The Target Value Chain Diagram describes the desired
sequence of activities that deliver products or services in the target state. Activities in the value chain are designated
as being either primary or support activities.
·
TEMPLATE: Link
to Target Value Chain Diagram Template (Visio)
·
TEMPLATE: Link
to Target Value Chain Diagram Template (PDF)
As-Is Value Chain to Business Products and
Services Diagram: Business
products and services are mapped to the value chain to illustrate where value
creation occurs. This diagram helps
identify which activities and process areas are critical to the performance of
the business focus area.
·
TEMPLATE: Link to As-Is
Value Chain to Business Products and Services Diagram Template (Visio)
·
TEMPLATE: Link
to As-Is Value Chain to Business Products and Services Diagram Template (PDF)
Target Value Chain to Business Products and
Services Diagram: Business
products and services are mapped to the value chain to illustrate where value
creation occurs. This diagram helps
identify which activities and process areas are critical to the performance of
the business focus area.
·
TEMPLATE: Link
to Target Value Chain to Business Products and Services Diagram Template
(Visio)
·
TEMPLATE: Link
to Target Value Chain to Business Products and Services Diagram Template (PDF)
Activity 2 – Decompose the
business function model
Activity Short Description:
The critical business functions are decomposed to
define a hierarchy of functional components. A business function is a logical set of
business processes performed on a continual basis that has no specific
beginning or end point. Functions are
decomposed into activities, which represent a group of business tasks usually
executed in a sequential fashion to achieve intermediate results.
Activity Tasks:
1. Develop
the business function hierarchy
a. Using
the Business Function Model template, the critical business functions
identified in the value chain analysis are decomposed into more fundamental
business functions and activities.
Existing reference models that catalogue enterprise business functions
may be used in structuring the functional hierarchy.
2.
Identify organizational units that perform the
business functions
a. Elements
of the business functional model are mapped to the organization to determine
where process or information hand-offs occur.
3.
Identify data interactions and interdependencies
between the business functions and organizational units
a. The
information exchange matrix is developed to describe the flow of business
information between business functions. This
mapping serves to link together the business and data architecture models, and
to identify data interdependencies and information flows that help define the
business process.
Activity Communications Considerations:
Business experts must be actively engaged to properly
identify business functions, especially in situations where a formal business
function reference model is not available
Activity Work Products and Templates:
Business Function Model: The business functional model represents a
functional hierarchy of the business focus area. The business model is used to identify key
lines of business and their associated functions and activities.
·
TEMPLATE: Link to Business Function Model Template (Visio)
·
TEMPLATE: Link to Business Function Model Template (PDF)
Activity 3 – Analyze the
current processes and their performance
Activity Short Description:
Critical business processes are described in detail in
order to depict the decisions, actions, and activities of the organization or
system. The analysis also identifies the organizations
that deliver specific functional components (i.e., who owns what). Interactions across organizational boundaries
in performing the business functions are described in the context of business
process using activity flow diagrams for the current state. Existing investments are also mapped to the
business products, services and functions in order to identify gaps in
investments, redundant investments, and investments that do not align with the
target state of services.
Activity Tasks:
1. Map
existing investments to the business products and services
a. The
existing investments are identified and analyzed to determine whether they
support the target business products and services for the business area and how
they relate to the business functions.
Results of this analysis are described using a matrix of the existing
investments that support the business products and services or business
functions.
2.
Develop the Swim Lane Process Diagram to describe
the As-Is process and information flow
a. Using
the sequencing of business functions and data flow identified in the value
chain, information exchange analysis, and business function hierarchy, an
overall swim lane process flow is developed to describe a high-level view of
how organizational units function in the context of the business processes to
deliver the products and services.
Activity Communications Considerations:
Business experts need to be consulted to ensure that
the appropriate details of the business functions are adequately represented
and that appropriate business process performance data are incorporated into
the analysis
Activity Work Products and Templates:
Existing Investments to Business Products
and Services / Functions Matrix: This matrix describes which of the existing
investments support the business products and services or business functions
identified in the analysis of the business products and services and the business
function model.
·
TEMPLATE : Link to Existing Investments
to Business Products and Services / Functions Matrix Template (Visio)
·
TEMPLATE : Link to Existing Investments
to Business Products and Services / Functions Matrix Template (PDF)
As-Is Swim Lane Process Diagram (actual
organization): The As-Is Swim
Lane Process Diagram describes the dependencies, roles, and interactions across
business functions and activities in the overall context of the current
business process.
·
TEMPLATE : Link to As-Is Swim Lane
Process Diagram (actual organization) Template (Visio)
·
TEMPLATE : Link to As-Is Swim Lane
Process Diagram (actual organization) Template (PDF)
Activity 4 – Define key
target processes / data and their target performance
Activity Short Description:
The target business processes and data environment are
analyzed to identify opportunities for process improvement and target
information requirements. The scope of
this analysis should focus only on critical processes and activities, at an
appropriate level of detail and granularity, so as to:
·
Identify which business processes need to be
reengineered
·
Facilitate the derivation of the data
architecture from the business architecture, and
·
Maintain traceability between the business
architecture and data architecture.
The target business processes are defined consistent
with the Business Function Model and the organization’s business reference
model. Processes are a group of related
business activities performed to produce an end product or to provide a service
or service component. Unlike business
functions that are performed on a continual basis, processes are characterized
by the fact that they have a specific beginning and an end point marked by the
delivery of a desired output. The figure
below depicts the relationship between the business processes, business
functions, and the organization’s business reference model.

Data dependencies and interactions are also captured
using the information exchange matrix.
Once the models are aligned, the target business process and data entity
matrices are used to identify information exchange requirements, support
planning for business services, and recommended principal data stewards for
related groupings of information.
Activity Tasks:
1. Develop
the Swim Lane Process Diagram to describe the target process and information
flow
a.
Using the sequencing of business functions and
data flow identified in the value chain, information exchange analysis, and
business function hierarchy, an overall swim lane process flow is developed to
describe a high-level view of how organizational units function in the context
of the business processes to deliver the products and services.
2. Define
and analyze the target business processes and performance
a.
For critical business processes, the process
model is defined in more detail using Activity diagrams to describe the tasks,
inputs, outputs, guidance, and enablers associated with each business process. This analysis should consider available efficiency
metrics associated with the outputs from the critical business processes. The detailed process model also includes the business
activities and the related data and information exchange mechanisms that will
be catalogued using the information exchange matrix.
b.
This activity will produce the Activity Diagrams
for Critical Value Chain Components and the Target Swim Lane Process Diagram (proposed
organizations).
3. Review
the mapping of existing investments to the business products, services and
functions in order to identify gaps or investments that may not align with the
target business architecture.
a.
Any gaps or investments not aligned with the
target state will provide the basis for developing findings and recommendations
in MBT Step 5.
4. Define
and analyze the target data environment
a.
The purpose of this activity is to develop the
Target Logical Data Model for the business area and understand how data and
process interact with each other in the target state. The Logical Data Model will decompose the
related subject area and information classes within the data reference model
and establish a structural and semantic data framework aligned with target
business activities that will support the identification of authoritative data
sources and the standardization data.
The data and process interaction analysis serves to validate the
decomposition of both models and provide a basis to define business service
components and information stewards and stakeholders.
b.
This activity will produce updated work
products, including: the Target
Information Exchanges; the Target Logical Data Model; the Target Business
Activity to Data Entity CRUD Matrix; and the Data Entity Stewardship Matrix.
Activity Communications Considerations:
Business experts need to be engaged in defining the
target business and data models.
Activity Work Products and Templates:
Target Swim Lane Process Diagram (proposed
organizations): The Target Swim
Lane Process Diagram describes the dependencies, roles, and interactions across
business functions and activities in the overall context of the business
process in the target state.
·
TEMPLATE: Link
to Target Swim Lane Process Diagram (proposed organizations) Template (Visio)
·
TEMPLATE: Link
to Target Swim Lane Process Diagram (proposed organizations) Template (PDF)
Activity Diagrams for Critical Value Chain
Components: The activity
diagrams view the activity by considering the specific inputs, outputs, mechanisms
and controls of the functions or activities that comprise the process. Critical value chain activities are described
in more detail using activity diagrams to depict the decisions, actions, and
activities of an organization or system.
·
TEMPLATE: Link
to Activity Diagrams for Critical Value Chain Components Template (Visio)
·
TEMPLATE: Link
to Activity Diagrams for Critical Value Chain Components Template (PDF)
Target Data Entity Stewardship Matrix: The Data Entity Stewardship Matrix maps the
Logical Data Model Information Classes and core entity types to organization
Principal Data Stewards to be responsible for the creation, maintenance and
quality of data to support target business activities in the target
environment.
·
TEMPLATE: Link
to Target Data Entity Stewardship Matrix Template (Excel)
Target Logical Data Model: The Logical Data Model provides the
structural and semantic data framework aligned with target business activities
that will support the standardization data and interoperability of data in the
target state. The model includes core entities,
key attributes and interrelationships between data entities that align with and
decompose related subject area(s) and information classes with the data
reference model.
·
TEMPLATE: [Note: No generic template is provided, as this work
product is typically generated using the available data architecture modeling tools within the organization]
Target Information Exchanges: The Information Exchange Matrix (IEM) is a
link between the Business architecture and the Data architecture. It describes the information flow between the business
functions and activities define on the Target Swim Lane Process Diagram.
·
TEMPLATE: Link
to Target Information Exchanges Template (Excel)
Target Business Activity to Data Entity CRUD
Matrix: The Target Business
Activity to Data Entity CRUD (Create/Read/Update/Delete) Matrix maps the Target
Logical Data Model to the Target Business Activity Models to record how data
and process will interact with each other in the target state. The CRUD matrix helps identify anomalies
between the process and data models such as new data requirements to support
target business activity requirements and new processes to move data through
its life cycle from creation to disposition.
The CRUD Matrix is also used to scope cohesive business and data
services.
·
TEMPLATE: Link
to Target Business Activity to Data Entity CRUD Matrix Template (Excel)
Activity 5 – Formulate the business analysis
results and brief to governance teams
Activity Short Description:
This activity involves developing a summary of the
results of the business analysis and providing a briefing to the governance
teams. The key messages for the
governance teams are focused on what is the underlying need for change, and
what changes in business processes, data dependencies, information flows, and
existing investments are required to effect the change.
Activity Tasks:
1. Create
a summary briefing
a. The
summary briefing describes the target business products and services, a summary
of the business process and data analysis, and the results of the mapping of
existing investments to business products and services.
2.
Brief the governance teams
a. Either
through a formal presentation, status review, or formal distribution, results of
the business analysis are provided to the governance teams. The purpose of this communication is to solicit
feedback from the governance teams in order to identify and resolve any issues
that may exist. Incorporate approved
feedback into the analysis, notes, work products, and other artifacts as
necessary.
Activity Communications Considerations:
The Executive Sponsor should present the results of
the business analysis to the appropriate governance teams
It may also be necessary to preview the results of the
business analysis with key governance team members in order to identify issues
up-front
Activity Work Products and Templates:
Business Process and Data Analysis
Presentation: This work product
is focused on what is the underlying need for change, and what changes in
business processes, data dependencies, information flows, and existing
investments are required to effect the change.
·
TEMPLATE : Link to Business Process and
Data Analysis Presentation Template (PPT)
4. Step
References
MBT Step 1:
Perform Blueprint Project Management, Version 1.5, December 2006
MBT Step 2:
Analyze stakeholders / drivers and define the target business strategy,
Version 1.5, December 2006